

If you’re asking why so many electric bikes come with small wheels, you’re probably weighing a fleet or rental purchase and trying to figure out whether 16-inch or 20-inch models are a smart fit or a risky shortcut. The short answer: smaller wheels usually make bikes easier to fold, store, and ship, and they can lower frame height. The tradeoffs show up in tire wear, extra parts to stock, and how the bike handles at speed or under load. This guide treats wheel size as a measurable specification rather than a style choice. It walks through the prerequisites, the design reasons behind small wheels, handling and stability tests, range and motor load, a lifecycle cost worksheet built from your own data, a bench-and-road test protocol, a use-case matrix, and a practical look at folding models. You’ll finish with a way to compare options and a clear next step.
Prerequisites: Data, Budget, and Time Needed
Before you test wheel sizes, you need three things: six months of maintenance data, a budget for matched test units, and 4 to 6 weeks on the calendar. Skip any of them, and your comparison becomes an opinion.
Don’t treat 26-inch wheels as the safe default. Test whether a smaller platform lowers total cost of ownership through fewer tire and rim SKUs, simpler on-site service, and denser storage and shipping. You only see those gains when you measure them yourself.
Data to collect first
- A fleet maintenance log export covering at least six months
- Fleet size, daily trip length, and route surface mix
- Rider weight range
- Supplier lead times for tires, rims, and spare parts
- Current puncture and downtime records
Use a calibrated scale, tape measure, tire pressure gauge, GPS or wheel-count logger, and spreadsheet to fill gaps. If punctures cluster on one route, that route becomes your test surface.
Budget for matched units
Buy 3 to 5 units per wheel size, all built on the same frame, motor, and battery. Add tires and spare rims for each variant. Some teams test one bike per size to save money. However, one unit per variant lets rider and route noise drive the result.
Time to plan
Allow 4 to 6 weeks. That covers data collection and one full test cycle.
Common mistake: Changing the motor or battery between variants. You then test the whole bike, not the wheel.
Step 1: Understand Why Small Wheels Exist and What They Cost
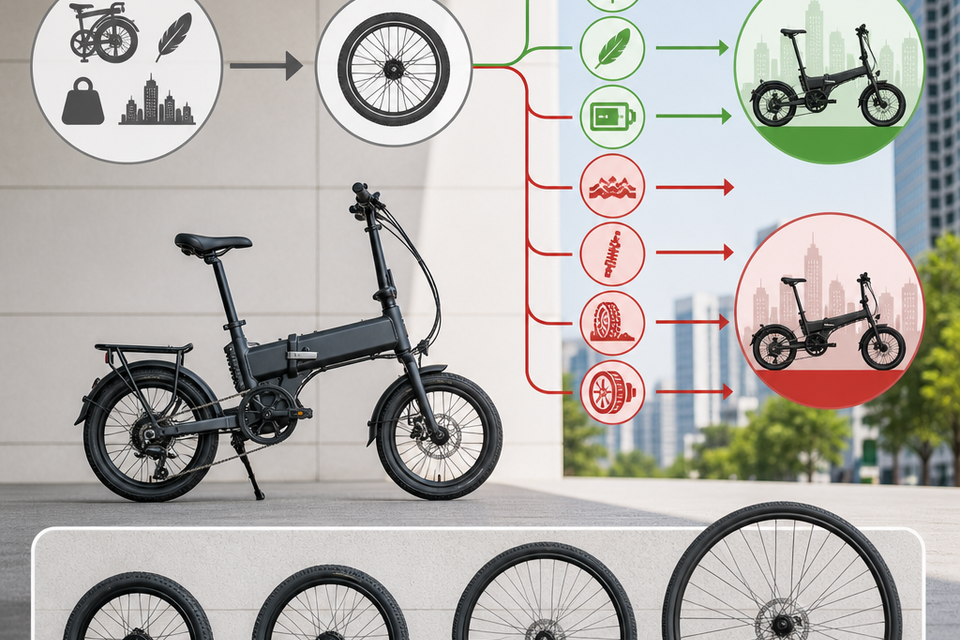
Small wheels are a deliberate trade-off, not a shortcut. They buy portability, weight savings, and urban handling at the cost of rolling efficiency and ride comfort. Evaluate that trade-off against your fleet’s actual use case before specifying wheel size.
Small wheels exist to cut folded size, lower the frame, reduce weight, and pack more units per container. Each benefit creates a cost you can measure: tire wear, extra parts to stock, and different handling at speed. Treat wheel size as a specification, not a style choice.
Map each reason to its cost
- Folding size: Smaller wheels shrink the folded footprint. The cost is a separate rim and tire SKU for every size you stock.
- Lower frame height and stand-over: Riders with shorter inseams step through more easily. The cost is a different high-speed feel, which depends on the frame geometry.
- Shipping density: More units fit per container. Check that gain against the added inventory line.
- Lighter weight: Smaller wheels can reduce weight. On rough surfaces, the cost is higher tire and rim wear per kilometer.
Example: A folding model on 20-inch wheels may fit your container plan. It still needs its own tire and rim line next to your 26-inch models. Ask procurement to count that as an added SKU, not a free swap.
Counter-argument: Some riders say small wheels feel unstable. Many urban riders prefer them for quick handling in traffic. The penalty depends on speed, load, and surface, so test your own use case.
Common mistake: Defaulting to 26-inch without checking your riders or routes. Heavier riders, riders over 50, and high-speed routes may need a different spec. Confirm before you choose.
Test protocol to run before you commit
Build three variants on the same frame, motor, and battery: 16-inch, 20-inch, and 26-inch. Record these results:
- Range: Fixed rider load of ____ kg on a defined loop of ____ km. Result: ____ km (16″), ____ km (20″), ____ km (26″).
- Energy draw: Standardized hill of ____ m at ____ % grade. Result: ____ Wh per climb per variant.
- Stability: Controlled high-speed runs at ____ km/h, with riders over 50 in a separate profile group. Sample size: ____ riders per group.
Publish the full method and sample size with every result. Leave any figure blank until your team collects the data.
Send your rider profiles and routes to our team through the contact page. Compare current models on the two-wheel e-bike range.
Step 2: Compare Handling and Stability Across 16″, 20″, and 26″
Test each wheel size on the same rider profile, and log wheelbase, trail, wobble onset speed, and steering corrections. Smaller wheels usually shorten wheelbase and trail, which quickens steering and can make high-speed stability harder to hold. Compare variants with measured data, not catalog specs alone.
Why it matters
Community posts from riders over 50 report that small-wheel e-bikes feel less stable at speed. A fleet operator carries that risk in its liability exposure, so the rider profile should drive the wheel spec.
Mechanics to know
- Smaller wheels reduce wheelbase and typically shorten trail, which speeds up steering.
- The gyroscopic effect scales with wheel mass and rotational speed. Smaller, lighter wheels add less stabilizing inertia.
- Fork offset, head-tube angle, and suspension can offset part of the gap. A 16-inch build with longer fork offset may hold steady at higher speed than a 20-inch build with shorter offset, even at the same wheelbase.
How to test it (about half a day for three variants)
- Measure wheelbase, head-tube angle, trail, and center of gravity for each variant. Record in mm.
- Mark a straight, smooth 100 m lane.
- Ride each variant at stepped controlled speeds. Log the speed where wobble appears.
- Count steering corrections per 100 m.
- Have each tester rate confidence on a fixed 1-5 scale.
Common mistake: Comparing wheel sizes on different frames. Change one variable at a time, or the results reflect frame design, not wheel size.
Pro tip: Test with the heaviest rider profile you plan to serve. Wobble often appears first at the upper weight
Step 3: Measure Range, Rolling Resistance, and Motor Load
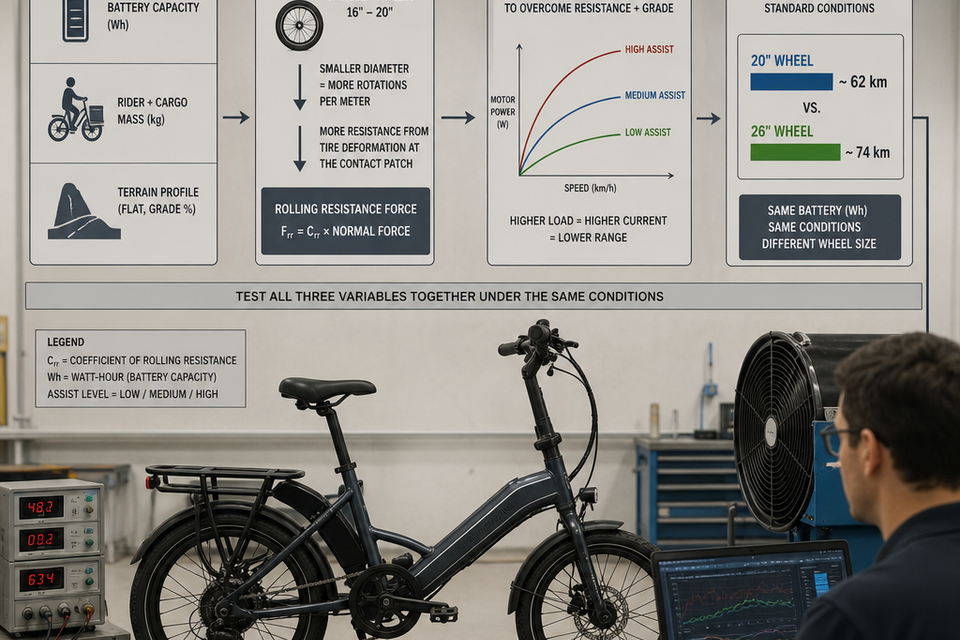
Smaller wheels change the rolling resistance and motor load equation, which directly affects range. Test all three variables together under the same conditions before comparing wheel sizes, because a range gap between models often reflects load and terrain differences rather than the wheel itself.
Run the same loop and the same hill on every wheel variant, then compare energy use per kilometre. That number shows whether small wheels cost more battery on your routes. Spec writers need it to set realistic range and torque targets.
Why it matters
Riders ask two questions: are small wheels harder to pedal, and do they drain batteries faster? A datasheet range figure answers neither unless its test conditions match your operation. Stop-start urban routes depend on acceleration and motor load. Long, flat routes depend on steady-speed drag.
How to run the test
- Fix the variables. Use one battery capacity, one tire pressure, and one rider weight for every variant. Write all three down.
- Set a loop. Choose a fixed length that matches your real routes, and record the surface mix. Ride it at the same assist level each time.
- Log each run. Record battery state before and after, elapsed time, and average assist level.
- Calculate the numbers. Energy use equals (Wh before minus Wh after) divided by km. Range equals full battery capacity divided by Wh per km.
- Test the hill. Ride one hill at one gradient. Log climb time, speed profile, and peak current.
Plan about half a day per variant for three repeat runs. Repeats show whether the difference is real or just noise.
Common mistake
Teams often compare advertised range across different battery sizes and tire pressures. Range mixes battery size with efficiency. Compare Wh per km instead, and hold pressure constant.
What to expect
Expect a trade-off, not a clear winner. A 20-inch variant may show higher rolling resistance on coarse asphalt but lower drag at low speed. Some suppliers quote range from a single flat run. That figure tells you little about a hilly delivery route. Your logs show which effect dominates.
Questions to ask before ordering
- What rider weight, tire pressure, and battery capacity did the range test use?
- What gradient and climb time apply to the stated torque target?
- Can you share energy use per km for each wheel size?
For spec-sheet requests, browse the two-wheel e-bike catalog or contact our team.
Step 4: Build a Lifecycle Cost Worksheet from Your Own Data
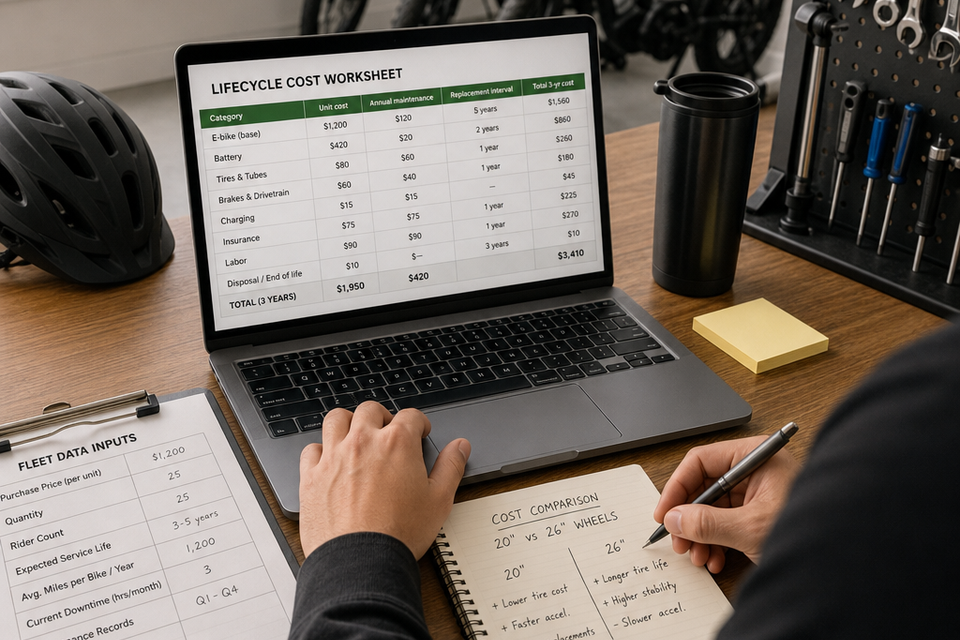
Your worksheet is only as useful as your inputs. Start with your own purchase and maintenance records, then compare scenarios such as wheel size, since tire wear and replacement intervals can shift total cost of ownership more than the sticker price suggests.
Calculate the annual cost per bike for each wheel size using numbers you measure yourself, then choose the lower total that your service network can support. Vendor estimates rarely reflect your road surfaces, labor rates, or supplier lead times.
Reframe the question. Don’t ask “which wheel size is best.” Ask “which wheel size fits this duty cycle and service network.” A bike that wins on a spec sheet can lose in a fleet where parts take weeks to arrive.
Why it matters: Procurement needs a documented basis for the decision. A worksheet gives you one, and it lets you defend the choice to finance and operations.
Inputs to measure
- Punctures per 1,000 km, from your maintenance logs
- Tire replacement interval (km)
- Rim replacement interval (km)
- Tire and rim unit cost
- Spare-parts lead time (days)
- Downtime per incident (hours)
- On-site repair labor (minutes)
- Number of unique tire and rim SKUs
The formula
Annual cost = (tire cost ÷ tire life km x annual km) + (puncture rate x repair labor cost) + (downtime hours x hourly revenue loss) + (inventory carrying cost of SKUs)
Run rim costs through the same tire line, using the rim interval.
Steps
- Pull at least 12 months of service logs for each wheel size. Split punctures by route type if your fleet covers different surfaces.
- Enter each input in a spreadsheet, with one column per wheel size.
- Calculate the four terms for each column and add them.
- Compare the totals. If the gap is smaller than your measurement error, the choice does not yet favor either size.
Example
Suppose one wheel size needs two tire SKUs and the other needs one. The two-SKU option carries more safety stock. If lead time runs 30 days, each extra SKU ties up cash and raises the chance of a stockout. The carrying cost term puts that expense on the same sheet as tire wear and downtime.
Common mistakes
- Using brochure tire life instead of your logged kilometers.
- Averaging puncture rates across all routes, which hides the worst streets.
- Ignoring lead time when you set stock levels.
Pro tip: Add a worst-case column using your longest lead time and highest puncture rate. If the same wheel size still wins, the decision holds under pressure.
Set diameter and tire-width targets from your worksheet results and supplier spec sheets, not from general rules. Request tire and rim specifications from the two-wheel e-bike catalog, or send your inputs through the contact page for a spec-sheet review.
Time required: About half a day if your logs are clean. Expect up to a week if you must rebuild them from invoices and work orders.
Step 5: Run the Bench-and-Road Test Protocol
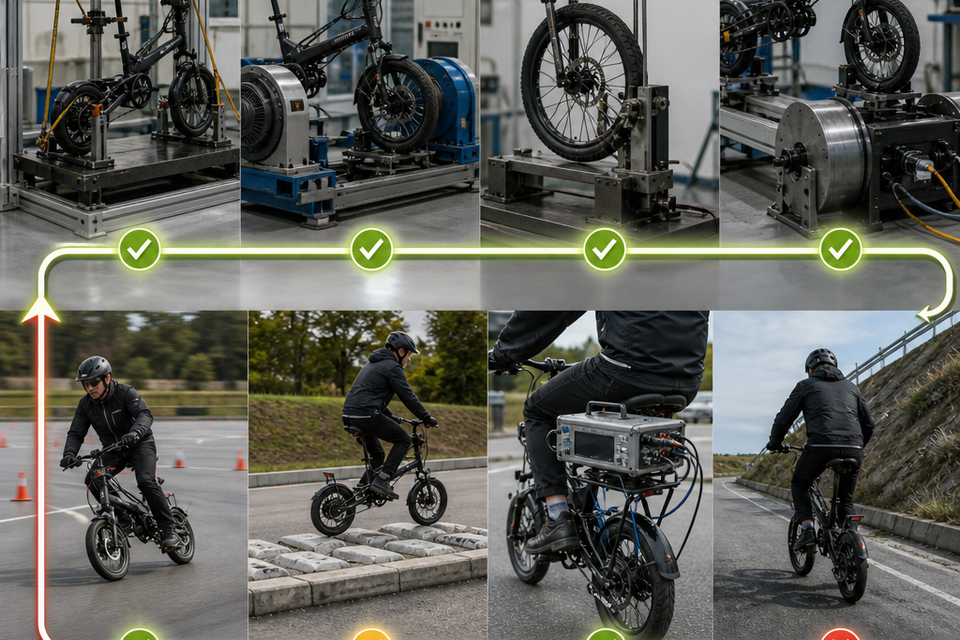
The protocol validates small-wheel e-bike designs in two phases. Bench tests isolate structural and drivetrain risks before road testing measures real-world handling, ride quality, and range. Any failed gate sends the design back for iteration, so the final design has been verified under both controlled and real-world conditions.
Step 5 means testing 16-inch, 20-inch, and 26-inch versions on the same frame, motor, and battery, then logging every run. This turns wheel size into a measured decision you can defend to finance and suppliers.
The useful question is not “which wheel size is best.” It is “which wheel size fits this duty cycle and service network.”
What to do
Build a test matrix of three wheel sizes, three rider profiles, and the bench and road tests below. Randomize run order so fatigue or changing weather doesn’t favor one variant. Record ambient temperature, surface type, and rider profile for every run.
Why it matters
A written protocol lets anyone check your method and sample size. Without one, wheel choice rests on rider preference. Community threads often ask whether small-wheel e-bikes feel unstable. Stability logs answer that question with data instead of opinion.
How to do it
- Run bench tests first. Measure motor torque at standstill, brake performance, and frame load. Failures here cost less time than failures on the road.
- Run road tests second. Cover a range loop, a hill climb, and stability runs at your target speed.
- Use at least five runs per variant per test. A matrix of 3 sizes, 3 rider profiles, and 5 runs produces 45 road runs per test. Plan roughly two weeks for this work, with bench tests done first.
- Report ranges, not single averages. State your sample size and why you chose it.
Example: Run stability tests with a rider in their 20s, a rider aged 50 to 65, and a rider at the upper weight limit of your spec. If the 16-inch variant performs well for the 20s rider but shows a wider spread for the older rider, you learn that before you commit to a fleet.
Use-case matrix
| Use case | Test emphasis | Documents to request |
|---|---|---|
| Commuting | Range loop, stability at target speed | Range logs, stability records |
| Last-mile delivery | Frame load, brakes, hill climb under payload | Frame load reports, brake records |
| Rental | Durability and brake tests across mixed riders | Durability records, brake records |
| Kids | Standstill torque, low-speed braking | Brake records, safety standard compliance |
| Older riders | Stability runs with the 50-to-65 profile | Stability records, brake records |
Questions to ask before you order
- Which bench and road tests did you run, and on which wheel sizes?
- How many bikes and runs did you test, and can I see the raw logs?
- Was the bike tested to a recognized e-bike safety standard for my market?
Browse the two-wheel e-bike catalog for spec sheets, or contact our team to request test reports for your matrix.
Step 6: Match Wheel Size to Your Use-Case Matrix
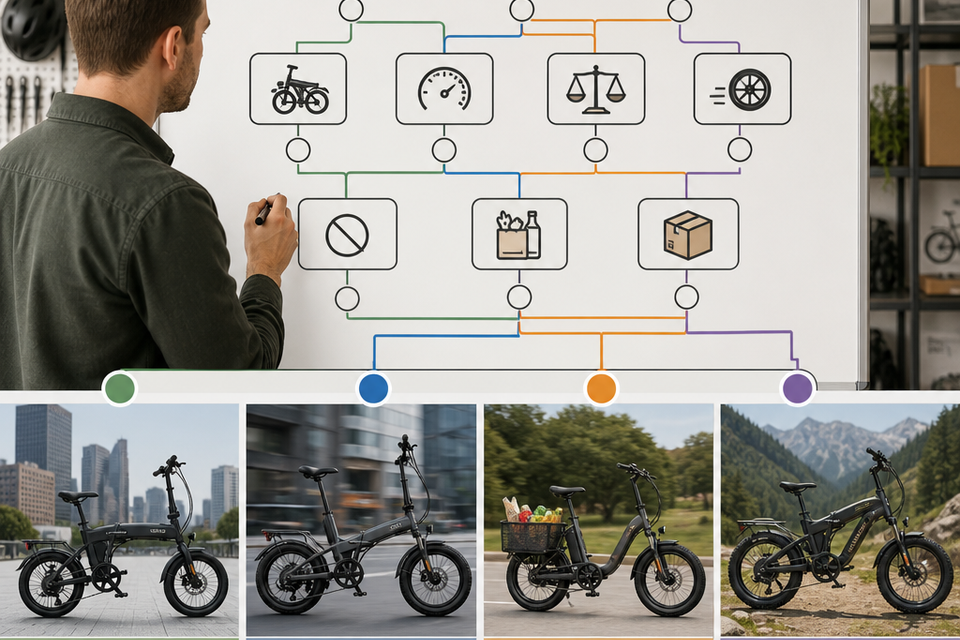
Smaller wheels trade rolling smoothness for compactness, quicker acceleration, and easier storage. Use this matrix to match wheel size to where and how you ride, not to default to the size that looks most common.
The right question is not “which wheel size is best?” It is “which wheel size fits this duty cycle and service network?” Assign a diameter and tire width to each use case, then request the test documents that back each choice.
Step-by-step process
- List your use cases with rider profiles. Note rider weight range, age, trip distance, terrain, and storage limits. Rental fleets often serve a wider height range than a single commuter.
- Assign a starting diameter and tire width from the matrix below.
- Request the documents for each case before you compare suppliers.
- Flag any case where test data does not support the choice. Do not order that spec until the supplier closes the gap.
Use-case matrix (starting ranges, confirm against supplier data)
| Use case | Diameter | Tire width | Documents to request | Open question for supplier |
|---|---|---|---|---|
| Commuting | 26″ | 1.9-2.4″ | ISO 4210 brake and frame reports; EN 15194 assist-limit test (EU); UL 2849 | Is the frame tested at our rider’s maximum weight? |
| Last-mile delivery | 20″ | 2.0-3.0″ | ISO 4210 frame and brake reports; UL 2849 | What is the rated payload, and was it tested with cargo? |
| Rental | 20″-26″ | 2.0-2.5″ | ISO 4210; EN 15194; UL 2849; local operator rules | Which rider height range does the frame cover? |
| Children | 16″-20″ | 1.75-2.1″ | ISO 4210 brake and frame reports; local minimum-age rules | Does the speed limit match our market’s class rules? |
| Older riders | 26″ or step-through 20″ | 1.75-2.4″ | EN 15194 assist limit; ISO 4210 brake test | How does the brake perform at the assist speed cap? |
| Folding or storage-limited | 16″-20″ | 1.75-2.1″ | ISO 4210 frame reports covering fold points | Has the folding hinge been tested for repeated use? |
Common mistakes
- Choosing one wheel size for the whole fleet. Mixed fleets usually match better to mixed use cases.
- Accepting “certified” without the report. Ask for the test lab’s name and the report date.
- Ignoring the rider weight limit. Confirm it is the rated maximum, not a typical figure.
Pro tip: Some buyers assume smaller wheels always feel less stable. However, the frame geometry and the rider’s weight matter more than diameter alone. Ask for stability or handling data at your rider’s weight, not a general statement.
Time and effort: Plan about one to two weeks to collect documents from two or three suppliers, depending on lab turnaround.
For spec-sheet requests, browse the two-wheel e-bike catalog or contact our team with your use-case list.
Step 7: Evaluate Folding Models as a Sourcing Decision
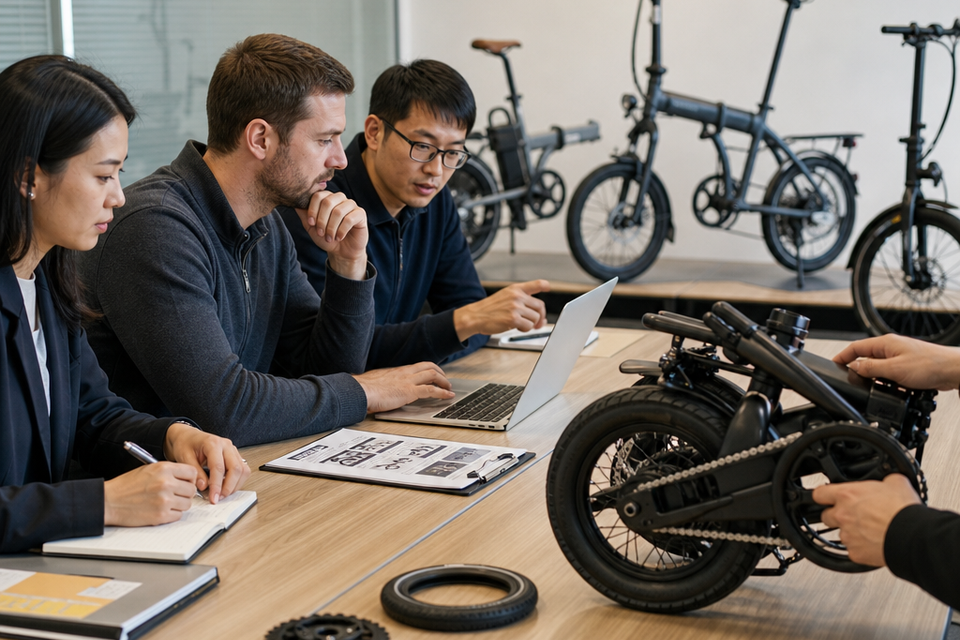
Small wheels are what make many e-bikes foldable, but that trade-off belongs in the sourcing scorecard, not just the spec sheet. Evaluate wheel size against your riders’ terrain and fleet needs before comparing price or MOQ, since it drives both fold size and ride quality.
Treat folding models as a sourcing decision, not a style choice. Weigh fold size, hinge and frame stress, container density, and warranty exposure against the performance penalty of small wheels.
Start by changing the question. “Which wheel size is best” invites opinion. Ask “which wheel size fits this duty cycle and service network” instead. Community threads keep asking whether small-wheel folders are overrated. Distributors need a sourcing basis, not a verdict.
1. Log the shipping numbers. Record folded dimensions and units per 40-foot container for each model. Ask the supplier to confirm both in writing, then check one with a packed sample.
2. Pull the durability data. Request hinge load test results and warranty claim rates by component. Confirm whether hinges and the fold point are covered, and for how long. Common mistake: comparing unit prices and skipping the warranty terms.
3. Score against Steps 2 and 3. Place your stability and range results next to the shipping and warranty figures. A folder that packs tightly but rides poorly fails the duty cycle.
The break-even test: extra units per container, multiplied by margin per unit, must exceed the added warranty cost per unit. Illustrative example: a folder ships 20 percent more units per container, but its hinge claims cost more than that gain. The cheaper-to-ship model loses money. Run the math with the claim rate the supplier gives you, not the one you hope for.
| Use case | Main priority | Documents to request | Question to ask |
|---|---|---|---|
| Commuting | Stability at speed, range | Stability and range test data | What load and speed conditions did the range test use? |
| Last-mile delivery | Hinge and frame durability | Hinge load test results, warranty terms | What payload is rated with the fold in use? |
| Rental | Low downtime, covered repairs | Warranty terms, parts list | How fast can hinge parts ship? |
| Kids | Fold safety, stability | Safety certification for your market | What rider height and weight limits apply? |
| Older riders | Stability, easy mounting | Stability test data | How does frame geometry affect low-speed handling? |
Set diameter and tire-width ranges from your own Step 2 and 3 data. The table shows what to verify, not which size
Common Wheel Size Mistakes Fleet Buyers Make
The most common wheel size mistake is choosing a size by habit, then checking fit later. Start with the duty cycle and service network, then pick the wheel.
Step 1: Stop defaulting to 26-inch.
- What: Treat 26-inch as one option, not the baseline.
- Why: Wheel size changes how many bikes fit in a van, rack, or storage room. It also changes how many SKUs your parts team must stock.
- How: Count rack space and van load per bike for each candidate size before you commit. Plan about one hour for this.
Step 2: Test stability before choosing small wheels for speed or cargo.
- What: Confirm that small wheels handle your real speed and load.
- Why: Rider forums often ask whether small-tire e-bikes feel unstable. Some argue small wheels suit short urban trips, and that holds for light loads. However, high-speed or heavy-cargo routes raise the risk.
- How: Ask suppliers for handling test data at your load and top speed. Then road-test two sample bikes on your actual route before you order volume.
Step 3: Get documents before you sign the purchase order.
- What: Collect written specs that cover your use case.
- Why: Catalog figures rarely show how wheels perform on your surfaces or under your loads.
- How: Request load ratings, test reports, and tire and rim part numbers.
Ask every manufacturer these questions before ordering:
- What load and speed is the wheel rated for, and which test report covers it?
- Which tire and rim parts can you supply after the first order?
- How do you support flat repairs in our service area?
Build your own matrix using rider weight, terrain, daily distance, storage limits, and rider age. Fill it with supplier data, not assumptions.
Compare sizes in our two-wheel e-bike catalog, or request spec sheets through our contact page.
Conclusion
The main takeaway is that 26-inch wheels are not automatically the safe default, and smaller wheels are not automatically the cheap option. The right size depends on your routes, rider profiles, storage and shipping limits, and how quickly your suppliers can get parts to you. Measure those inputs yourself, run the same tests across variants on the same frame, motor, and battery, and let the lifecycle cost worksheet show what each choice really costs per bike per year. Start by gathering six months of maintenance and downtime records and listing your fleet size, route surfaces, and rider weight range. Then, if you want spec sheets, test documentation, or help setting up a comparison for your program, reach out to our team through the contact page.
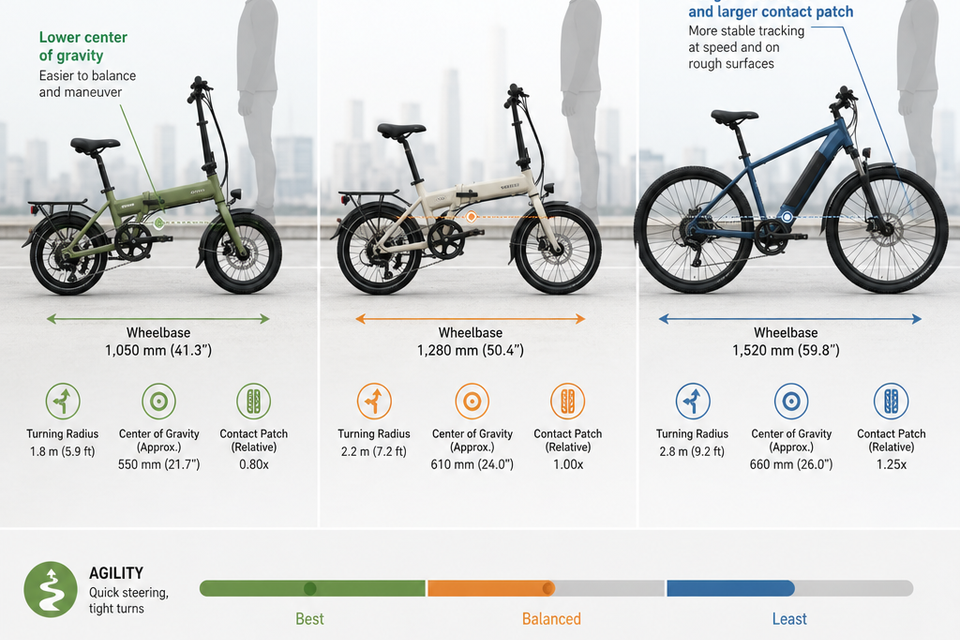
Smaller wheels (16″) deliver quicker steering and a lower center of gravity, which aids maneuverability in tight urban spaces. Larger wheels (26″) trade agility for straight-line stability and better rough-surface tracking. The 20″ middle ground balances both, which is why it is common in folding and commuter models.
Post time: Nov-19-2026